
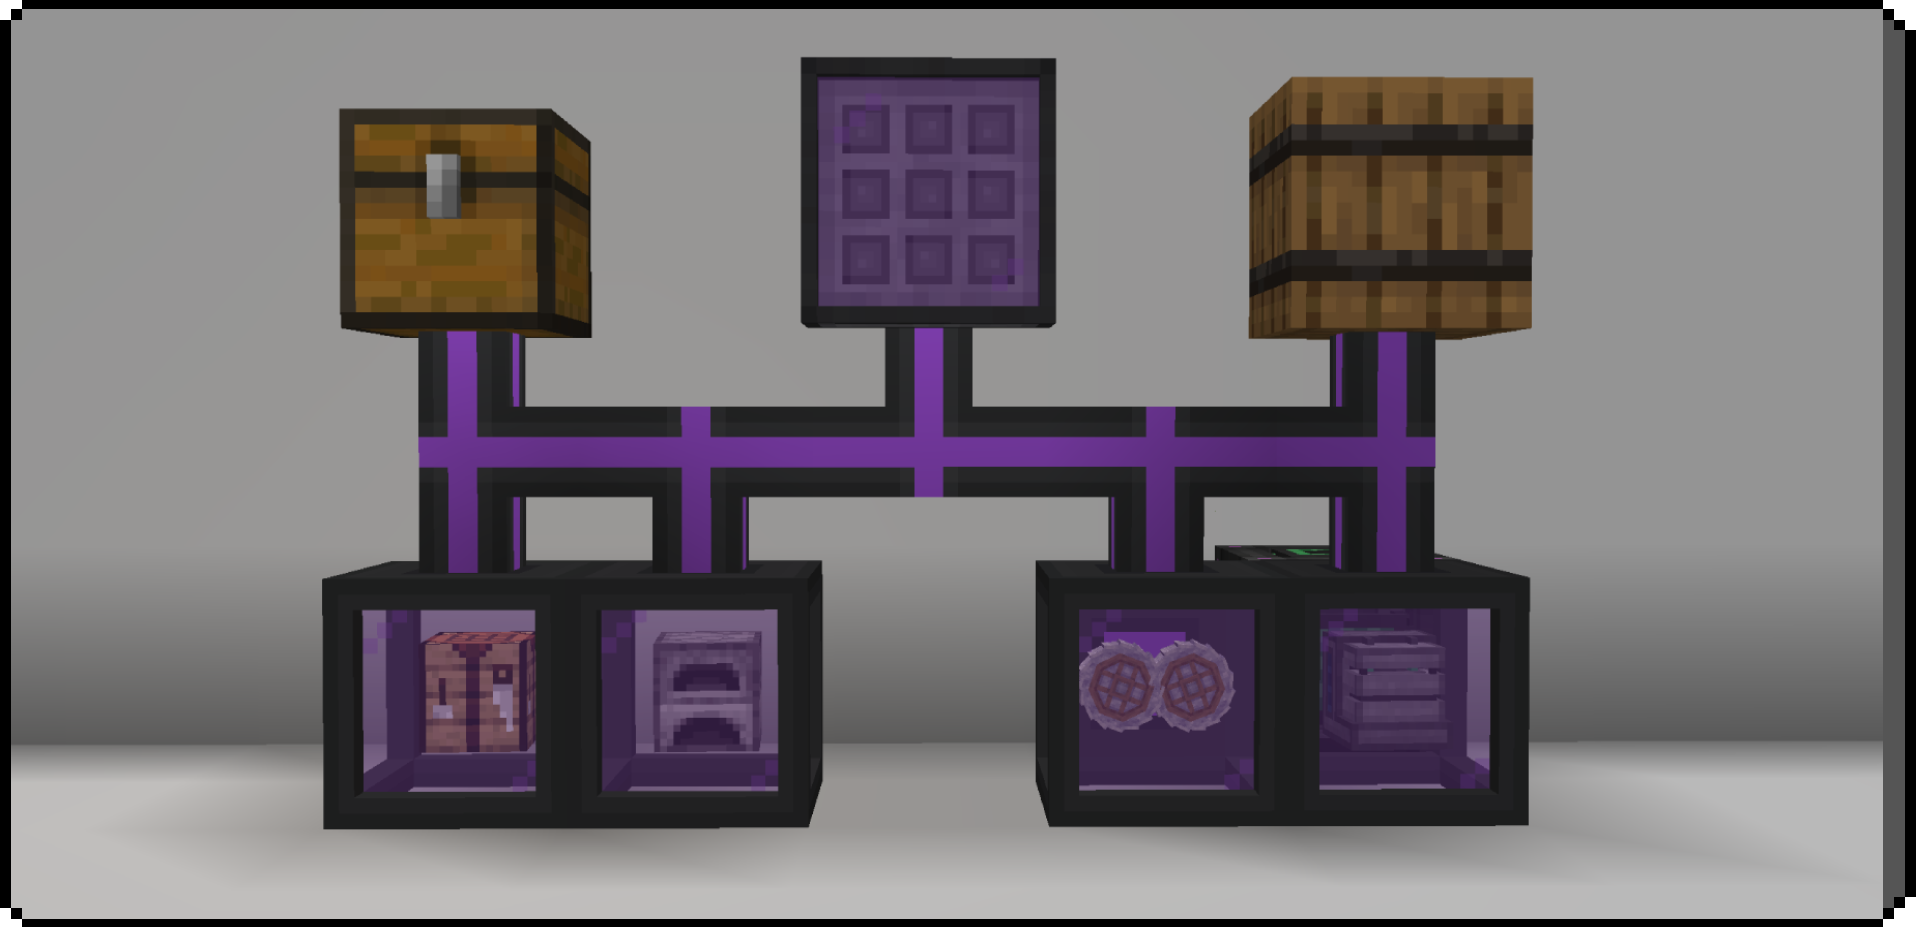
Place the terminal and connect it with pipes to the storage you want in the network — chests, barrels, another mod's storage.
Place a Veloce Integrale and right-click it with the block you want it to become — a crafting table, a furnace, a crusher from Mekanism. The frame turns into that machine and joins the network.
Right-click the terminal. Every item in the network is listed with its quantity, and a + number shows how many of each you could craft from the resources you have.
Add more machines and the list grows — each one brings its own recipes.
Some modules need energy to run, and they consume a lot of it — instant processing has to be paid for, and the price is set so that running this as a farm is not worthwhile.
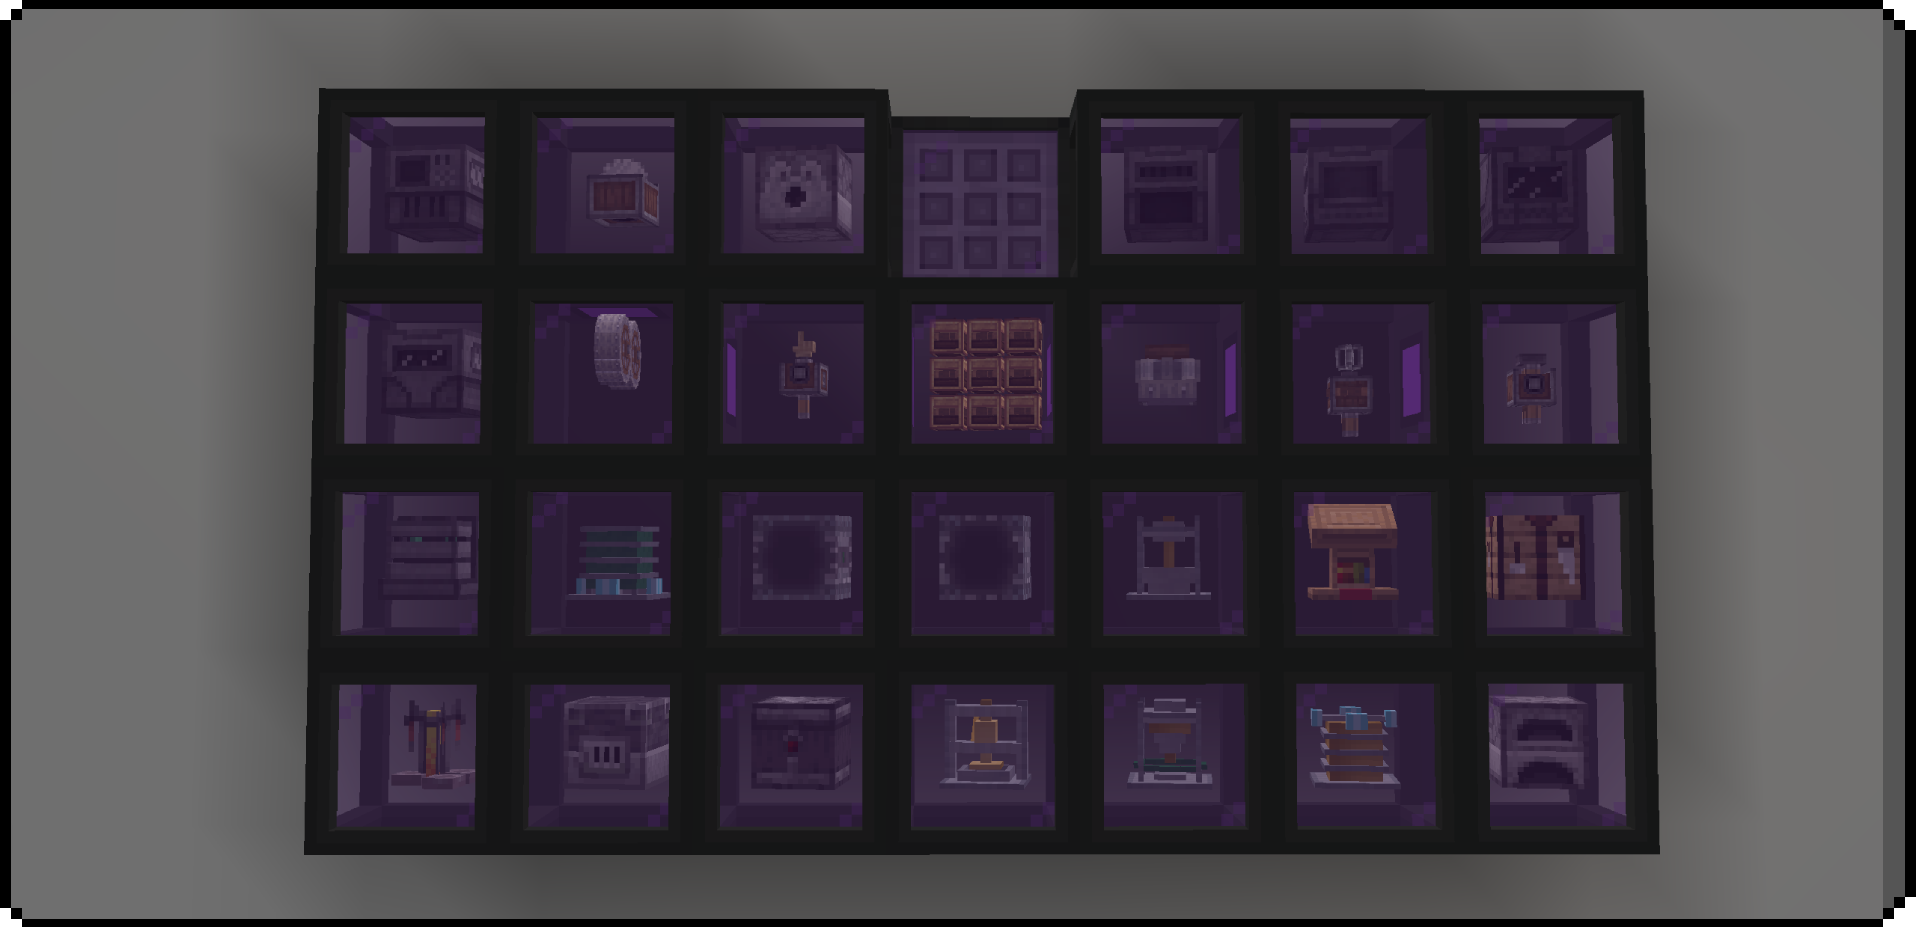
Veloce Terminal — your gateway to accessing the Veloce network. Shows the quantity of each item and how many of each can be crafted.
Veloce Pipe — connects everything. Each side is set independently to Push,
Pull or Disconnected, cycled with the wrench. Push and Pull can only be set on
ordinary containers — other network blocks simply connect.
Veloce Integrale — the heart of the mod. The casing every machine sits in, and the block pipes connect to.
Veloce Wrench — the tool for configuring pipe sides.
Veloce Controller — shows which items in the network can be crafted and which cannot.
Veloce Extractor — continuously pulls matching items out of the network into its own inventory. It reacts to redstone: while it is powered, it stops pulling, and it resumes the moment the signal drops.
Veloce Threshold Sensor — watches how many of one item are physically in the network and emits a redstone signal. Two modes: when at least and when below. Polls once a second.
Veloce Crafting Table — decides what the network is allowed to auto-craft. Click an item to toggle it on or off.
Velocity Furnace — the fuel-powered heat source for the auto-crafter. It does not physically smelt anything itself: it burns fuel continuously and banks the burn as heat, and the auto-crafter spends that heat to make furnace recipes instantly. You can set filters for what it is allowed to burn in its GUI; by default it burns everything burnable.
Velocity Electric Furnace — works like an ordinary furnace, except that it smelts with FE instead of fuel: it burns nothing, and the power comes from its built-in accumulator.
Veloce Brewing Stand — the brewing stand for the Veloce network.
Mekanism — 6 machines (all of them need FE to work): crusher, enrichment chamber, precision sawmill, combiner, osmium compressor, metallurgic infuser.
Alchemistry — 7 machines (all of them need FE to work): compactor, combiner, dissolver, liquifier, atomizer, fission chamber, fusion chamber.
Create — 7 machines: millstone, mechanical saw, crushing wheels, mechanical press, mechanical mixer, deployer, mechanical crafter. Each machine needs a constant 256 RPM and 1 024 SU.
Crushing Wheels only work in pairs — a single wheel does nothing.
Mechanical Crafters form an array: right-click to add another crafter to it, and the array can grow up to 9×9.
CraftingVeloce can connect with networks from other mods — Tom's Simple Storage and Refined Storage.
It also connects with Create, Mekanism and Alchemistry: their machines join the Veloce network, and everything those machines can produce becomes something you can ask the terminal for.
| Minecraft | 1.21.1 |
| NeoForge | 21.1.250 |
| Java | 21 |
| Gradle | 8.14.3 (wrapper included) |
Every integration is optional. The mod starts and works with none of Create, Mekanism,
Alchemistry, Tom's Simple Storage, Refined Storage, JEI or Jade installed, because each one
sits behind a gate class that is loaded only once its mod is present — see
com/craftingveloce/compat/ and the validate_compat_gates guard.
./gradlew :neoforge:build verifyGuardsverifyGuards runs the guard suite in scripts/build.py against the source and the built
jar. It must end with 47 passed, 0 failed, 0 skipped. The guards are auto-discovered
by scripts/guards.py from every validate_* function that takes no required arguments,
so a new check cannot be forgotten from a hand-maintained list.
The guards exist because the expensive bugs here are the silent ones: a drop that returns the wrong item, a config default that drifts from the compiled value, a JEI category that no longer matches the table the block actually consults. Each guard carries a comment saying what it protects and, where it applies, the player report that produced it.
./gradlew :neoforge:runClient
./gradlew :neoforge:runTestClient -PveloceTest=module-create
The test client has a game directory of its own (run-tests/), so it cannot fight a client
you have open. Test scripts live in neoforge/veloce-tests/ and are driven by
VeloceTestDriver; the verdict is written to neoforge/run-tests/veloce-test-result.txt,
whose first line is PASS on success. Do not read the process exit code — Minecraft
exits non-zero even on a green run.
Do not rebuild while a client is open. A running client reads classes lazily, so a build underneath it leaves it in an inconsistent state.
assets/, data/     resources for the mod, pulled into the jar by processResources
src_meta/          META-INF/neoforge.mods.toml, injected the same way
neoforge/          the mod itself - the module that is built
neoforge-26.1.2/   an experimental second target, not part of the release
scripts/           build guards, texture and model generators, isolation test
libs/              local compileOnly jars for mods with no public maven
A network is a flat set of pipes and nodes rather than a graph that merges and splits, and
the pipes carry items only, never FE. Crafting is planned on numbers rather than on
items: the planner walks recipe trees against a stock snapshot and decides what it will
make before anything moves, which is why a craft can be refused with a reason instead of
failing halfway through. Every machine joins the network through a small interface rather
than a shared base class, and the core never names a foreign mod's type — that isolation is
what validate_core_isolation and validate_compat_gates are for.
Two files, and the difference between them is the point:
| file | type | holds |
|---|---|---|
config/craftingveloce-common.toml |
COMMON | debug logging |
config/craftingveloce-server.toml |
SERVER | per-machine FE battery size and cost per operation |
The FE values are a SERVER config deliberately: NeoForge syncs server configs to the client, so a player joining a server receives that server's numbers instead of keeping their own. A COMMON or STARTUP config would leave every client on different values, which for a battery size is a disagreement about the game rather than a preference.
Every machine has a section of its own:
[mekanism_crusher]
    capacity = 25000000
    fePerOperation = 200000
The defaults are the values the machines were built with, so a pack that never opens the
file gets exactly the behaviour described above. validate_block_config_defaults compares
every default against the machine's compiled value, so the two copies cannot drift apart
unnoticed.
Most of what is hard to see has a command: /cv debug, /cv debug perf,
/cv debug chunk status, and /cv kinetic place|read, which builds a machine against a
rotating source and reports its speed and the stress it applies. /cv test run <script>
replays a test script in game.
/cv block — stats for the block you are looking at: speed and how many RPM are
missing, SU draw (and how much the module is asking for), the stress and capacity of the
kinetic network, the clicked-in elements, and for FE machines the energy, the cycle cost and
the number of cycles. The data comes from the same VeloceModuleInfoSource.moduleInfo that
the machine window and Jade use, so the command works for Create, Mekanism and Alchemistry.
Crafting failures carry a reason computed where the failure happened rather than a generic "item not in network": the missing ingredient, and — when another machine could have made it — which mods have a recipe for it, shown on the red items in the Veloce Controller tooltip.
profilerEnabled in craftingveloce-common.toml (off by default, and independent of
debugEnabled — the profiler is wanted exactly where the ordinary debug log is drowned out by
other mods) measures how long this mod's own operations take, function by function, and
writes the breakdown to logs/latest.log under [Veloce][PROF]. /cv profile [on|off|report|reset]
is the same switch from inside the game, so a large pack does not have to be restarted to use it.
A session covers one thing the player did. For the terminal it runs from the right-click to the numbers arriving: the server opens it (it scans the network and syncs the counts before the client has built anything), the client adopts it without clearing it, and the client closes it when the page arrives. That ordering matters — a session opened when the screen was built would cut off the server half that ran at the moment of the click. In singleplayer the client, the server and the counting worker share one JVM, so ONE report contains all three sides.
Each row is: total ms, share of the sum of all rows, call count, worst single call, and — for the labels that count work — units and microseconds per unit:
[Veloce][PROF] ===== terminal open: 41 value(s) received, complete=true =====
[Veloce][PROF] wall clock 812 ms (sum of sections 1204 ms)
[Veloce][PROF]   client.refreshSearchResults            401 ms  33.3%     2 call(s) worst 399 ms
[Veloce][PROF]   client.applyItemFilter.scan            240 ms  19.9%    21 call(s) worst  38 ms   1050000 unit(s)   0 us/unit
[Veloce][PROF]   server.captureSnapshot                 180 ms  15.0%     1 call(s) worst 180 ms
[Veloce][PROF]   server.network.getAllItemCounts         70 ms   5.8%     2 call(s) worst  68 ms
[Veloce][PROF]   worker.OFF-THREAD.countPage             55 ms   4.6%     1 call(s) worst  55 ms
[Veloce][PROF] =====================
How to read it:
- call count separates the two kinds of problem. A one-off cost on opening a screen runs
once; a stall that eats the frame rate runs twenty times a second (
client.containerTick,client.creativeScreen.containerTick.applyItemFilter,server.tick.*). Neither the total nor the average says which it is on its own. - units / us per unit is what travels between packs: "1 050 000 items scanned" is comparable with a small pack, "240 ms" is not.
- worst exposes an operation that is cheap on average and occasionally does a registry scan.
- The prefix says which thread it ran on.
client.*is the client thread,server.*andsnapshot.*the server thread,net.*the network thread, andworker.OFF-THREAD.*the counting thread — which cannot be the cause of a freeze, because it does not run on the game thread. Seeing it at the top of a report while a freeze was real means the answer is in one of the other families. - Nesting: a measured block can contain others (
snapshot.closurecontainssnapshot.closure.resolveRecipes), so a child's time is also counted in its parent and the shares can add up to more than 100%. The dotted labels show the nesting. - A partial answer (the server sends the network's cached numbers first) prints a
[SNAPSHOT - session continues]report and leaves the session open, so the work that follows is still measured. Only the final answer closes it. - Any single operation over 50 ms is reported the moment it ends, so a session that never completes still leaves a trace.
Starting the game and joining a world are profiled too, under the load.* labels, and reported
twice so the two waits are not mixed up:
[Veloce][PROF] ===== LOAD 1/2 mod loading: our registration + compat setup =====
[Veloce][PROF] ===== LOAD 2/2 world ready: our recipe indexes + first ticks =====
The first covers mod construction (load.register.*), the RegisterEvent work
(load.registry.*), the optional integrations (load.compat.*.module / .family) and the
client registrations (load.client.*). The second covers what happens between mod loading and
the world being ready — mainly the first build of our recipe indexes (load.recipeIndex.*),
which walks every recipe the pack has and is paid during the join — plus our per-tick cost while
the world comes up.
Two things to know about these rows:
- They are measured even when
profilerEnabledis off, because the config is not readable during mod construction and a switch-gated section would measure nothing at the one moment the player is waiting. There are only a few dozen of them, so the cost is nothing; the output is what the switch gates. - The compat setup runs on NeoForge's parallel mod-loading threads, so those rows can add up to more than the wall clock. That is the loader using several cores, not a measurement error, and it is why each integration has its own label instead of one "compat" total.
What a load report cannot tell you is why a large pack takes minutes: most of that time belongs to other mods (in the reference pack, a single EMI recipe reload took 51–61 s), and this profiler only measures this mod's own functions. What it does tell you is whether our share of the wait is milliseconds or seconds — the only part this mod can do anything about.
Measuring it that way found a real cost and it is fixed: every recipe index is built lazily on
first use, so the first terminal page after a world loads paid ~650 ms of index building on the
server thread (365 ms in a single "which mods can make this" query, 175 ms in the snapshot
capture, 105 ms for the vanilla crafting index). The indexes are now built by
VeloceRecipeWarmup on the counting worker as soon as the world starts — it shows up in the
report as worker.OFF-THREAD.warmIndexes and logs one line saying how long it took. Nothing
depends on it: the lazy build still exists, so a failure there costs the old, slower behaviour
and nothing else.
All packets use the NeoForge CustomPacketPayload / StreamCodec.
| Packet | Direction | Contents |
|---|---|---|
BufferPullItemPKT |
C→S | BlockPos pos, ItemStack itemStack, int count |
ControllerFlowRequestPKT |
C→S | BlockPos pos |
CraftingTableCycleRecipePKT |
C→S | BlockPos pos, Item item, ResourceLocation recipeId |
CraftingTableToggleItemPKT |
C→S | BlockPos pos, Item item |
ExtractorToggleCraftingPKT |
C→S | BlockPos pos, int filterIndex |
OpenControllerScreenPKT |
S→C | BlockPos pos, Map<Item, Long> stock, Set<Item> craftingEnabled, Set<Item> furnaceCraftable, boolean furnacePowered, Set<Item> furnacePreferred |
OpenCraftingTableScreenPKT |
S→C | BlockPos pos, Set<Item> enabledItems, Map<Item, ResourceLocation> preferredRecipes, List<ItemStack> bufferContents |
OpenFilterPKT |
C→S | BlockPos pos, int filterIndex |
OpenFilterPickerPKT |
S→C | BlockPos pos, int filterIndex |
OpenTerminalScreenPKT |
S→C | BlockPos terminalPos |
RequestCraftableCountsPKT |
C→S | BlockPos pos, List<Item> items |
GuiCountsProbePKT |
C→S | BlockPos pos, int slotsWithItems, int distinctItems, int withCounts, boolean potionCounted, String potionReport, String withoutCounts |
SensorConfigPKT |
C→S | BlockPos pos, long threshold, boolean highMode |
SetTerminalSearchPKT |
S→C | String phrase |
ControllerPreferKindPKT |
C→S | BlockPos pos, Item item, boolean preferFurnace |
SetFilterPKT |
C→S | BlockPos pos, int filterIndex, ItemStack filterItem |
SyncControllerFlowPKT |
S→C | BlockPos pos, Map<Item, Long> changed, Set<Item> removed, Map<Item, Float> rates, boolean full |
SyncCraftableCountsPKT |
S→C | BlockPos pos, Map<Item, Long> counts, Map<Item, String> madeBy, boolean complete |
SyncCraftingTableStatePKT |
S→C | BlockPos pos, Set<Item> enabledItems, Map<Item, ResourceLocation> preferredRecipes |
SyncExtractorFiltersPKT |
S→C | BlockPos pos, List<ItemStack> filters, List<Boolean> allowCrafting |
SyncTerminalCountsPKT |
S→C | Map<Item, Long> itemCounts, Map<Item, Long> craftableCounts |
TerminalCraftErrorPKT |
S→C | BlockPos terminalPos, ItemStack itemStack, String reason, String detail, String hint |
TerminalPullItemPKT |
C→S | BlockPos terminalPos, ItemStack itemStack, int count |
TerminalStoreItemPKT |
C→S | BlockPos terminalPos, int mode |
TerminalWatcherPKT |
C→S | BlockPos pos, boolean watching |
This table is generated from
VelocePacketHandler.java. It used to list packets that no longer exist (ExtractorSetFilterPKT,ExtractorOpenFilterPKT) and was unaware of eight new ones — exactly the same drift as with the other hand-written lists in this project. The build (scripts/build.py, step 4) now checks that every registered packet is listed here.
MIT — see LICENSE.