
This project provides a complete monitoring stack using Prometheus and Grafana, including exporters for host metrics, Docker containers, and system processes.
The project includes the following services:
- Prometheus - Monitoring system and time series database
- Grafana - Metrics visualization and analytics platform
- Node Exporter - Hardware and OS metrics exporter
- cAdvisor - Container resource usage and performance analyzer
- Process Exporter - System process metrics exporter
- Docker
- Docker Compose
-
Clone the repository (or navigate to the project directory)
-
Start all services:
docker-compose up -d- Verify that containers are running:
docker-compose ps- URL:
http://172.25.0.13:3000 - Username:
admin - Password:
MYPASSWORD
- URL:
http://172.25.0.10:9090
- Node Exporter:
http://172.25.0.11:9100/metrics - cAdvisor:
http://172.25.0.12:8080 - Process Exporter:
http://172.25.0.14:9256/metrics
.
├── docker-compose.yml                          # Services configuration
├── dashboards/
│   ├── Docker Monitoring-1764091626474.json    # Docker monitoring dashboard
│   └── Host Monitoring-1764091636759.json      # Host monitoring dashboard
└── data/
    ├── prometheus/
    │   └── config/
    │       └── prometheus.yml                  # Prometheus configuration
    └── process-exporter/
        └── config/
            └── process-exporter.yml            # Process Exporter configuration
Prometheus is configured to collect metrics every 120 seconds from the following targets:
- Prometheus (localhost:9090)
- cAdvisor (cadvisor:8080)
- Node Exporter (node-exporter:9100)
- Process Exporter (process-exporter:9256)
To modify the configuration, edit the data/prometheus/config/prometheus.yml file.
The default Grafana password is defined in docker-compose.yml through the GF_SECURITY_ADMIN_PASSWORD environment variable.
The project includes two pre-configured dashboards in the dashboards/ folder:
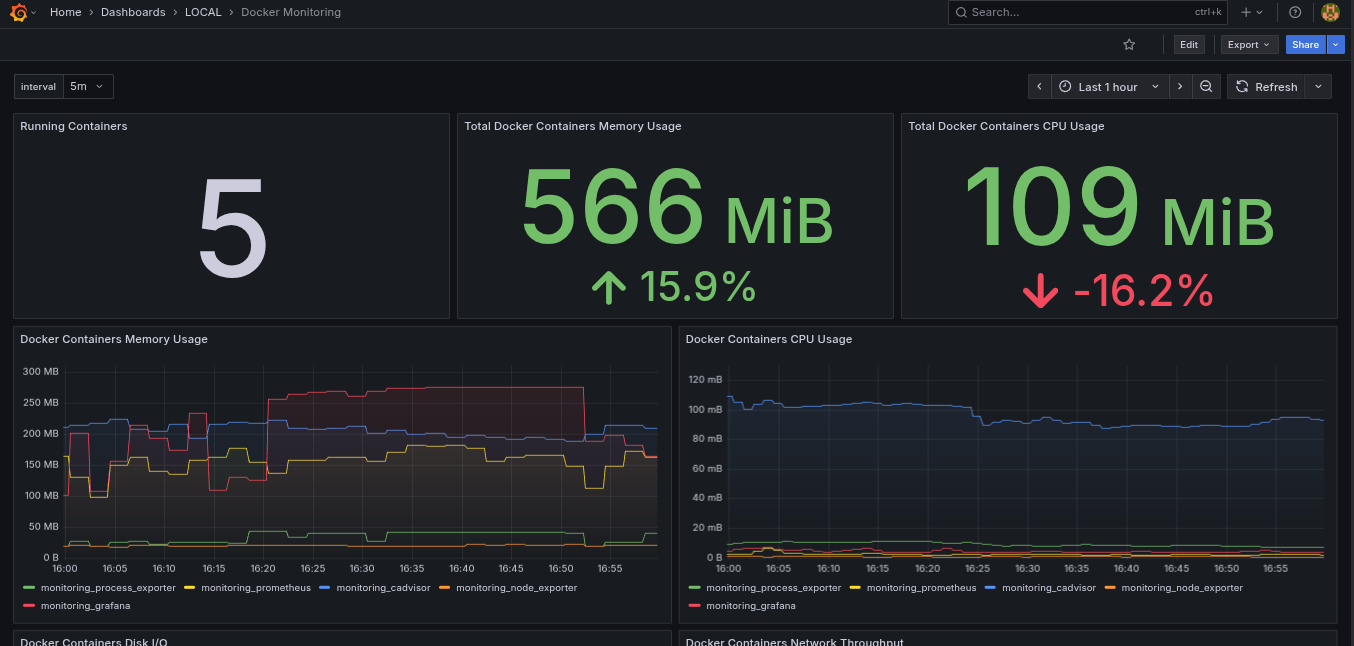
Available metrics:
- Running Containers - Total number of active containers
- Total Docker Containers Memory Usage - Aggregated memory consumption across all containers
- Total Docker Containers CPU Usage - Aggregated CPU usage across all containers
- Docker Containers Memory Usage - Time series graph showing memory usage per container
- Docker Containers CPU Usage - Time series graph showing CPU usage per container
- Docker Containers Disk I/O - Read/write operations per container
- Docker Containers Network Throughput - Network receive/transmit bandwidth per container
- Docker Container Memory Reservation Usage - Table showing memory usage against limits
- Docker Container Memory Usage - Table with current memory consumption per container
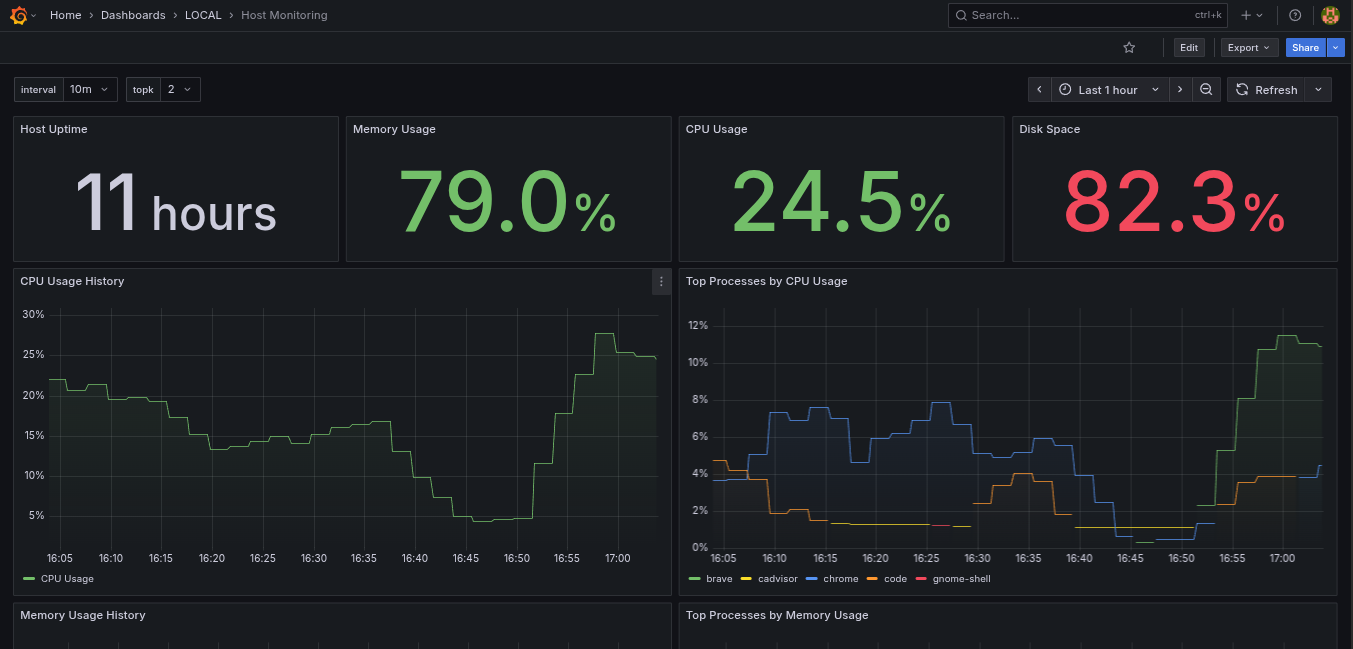
Available metrics:
- Host Uptime - System uptime in seconds
- Memory Usage - Current percentage of memory in use
- CPU Usage - Current percentage of CPU utilization
- Disk Space - Percentage of disk space used on root filesystem
- CPU Usage History - Time series graph of CPU utilization over time
- Top Processes by CPU Usage - Configurable top-k processes consuming CPU
- Memory Usage History - Time series graph of memory consumption over time
- Top Processes by Memory Usage - Configurable top-k processes consuming memory
- Disk IOPS - Input/output operations per second (read/write)
- Network Throughput - Network bandwidth usage (download/upload)
To import dashboards into Grafana:
- Access Grafana
- Go to Dashboards → Import
- Upload the JSON files from the
dashboards/folder
docker-compose up -ddocker-compose downdocker-compose logs -f <service-name>
# Example: docker-compose logs -f prometheusdocker-compose restart <service-name>docker-compose down -vAll services are on the same Docker network (monitoring) with the following IPs:
- Gateway: 172.25.0.1
- Prometheus: 172.25.0.10
- Node Exporter: 172.25.0.11
- cAdvisor: 172.25.0.12
- Grafana: 172.25.0.13
- Process Exporter: 172.25.0.14
The project uses Docker volumes for data persistence:
prometheus_data: Stores Prometheus time series datagrafana_data: Stores Grafana configurations and dashboards
- Change the default Grafana password in production
- Services are exposed only on the internal network (using
exposeinstead ofports) - For external access, configure a reverse proxy (nginx, traefik, etc.)
- Collection interval configured for 120 seconds (can be adjusted as needed)
- cAdvisor requires privileged mode to access container metrics
- Process Exporter uses
pid: hostto monitor host system processes
Feel free to make improvements and adjustments to the project!
This is a personal study project.